
The Response Rate report helps you analyse how quickly your organisation responds to reported concerns and whether cases are resolved within expected timeframes.
It combines three key indicators with a Dynamics chart, allowing compliance and investigation teams to review response speed, decision time, and timely case resolution.
Where to find the Response Rate report
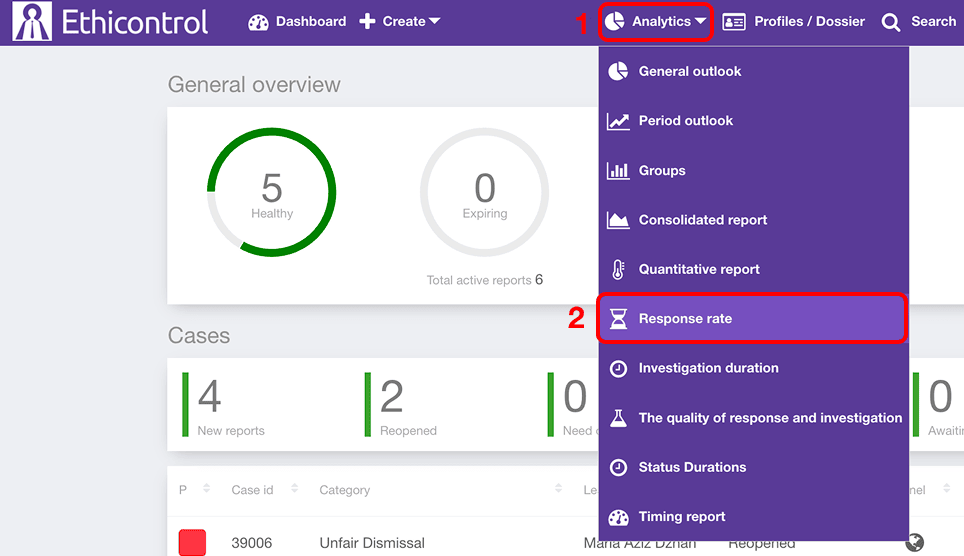 1. Open Analytics from the main navigation.
2. Select Response rate.
The report contains:
reporting period and filters;
three response-rate indicators;
a Dynamics chart;
calculation details for the indicators.
Select the reporting period
Use the date selector at the top of the report to define the period included in the analysis.
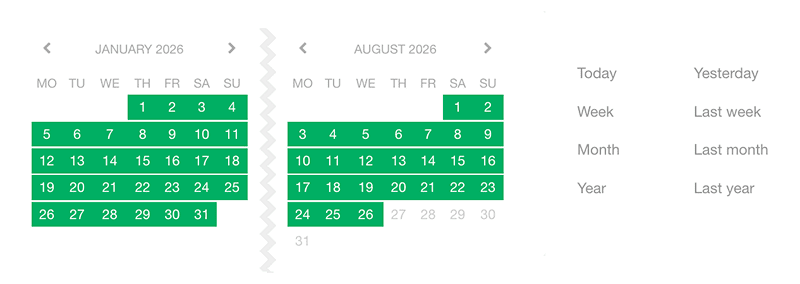
You can select a custom date range or use predefined periods such as:
Today;
Yesterday;
Week;
Last week;
Month;
Last month;
Year;
Last year.
Changing the period updates the indicators and Dynamics data.
Filter the report
Use the available filters to narrow the analysis to a specific group of cases.

Depending on your organisation's configuration, filters may include:
Category;
Unit;
Assigned user;
Channel;
Priority;
Region;
Segment;
Procedure;
Event date / Actual incident date;
Resolution date.
You can combine several filters to review response performance for a particular category, unit, investigator, reporting channel, or period.
Use Clear Filters to remove the selected filters.
Understand the main indicators
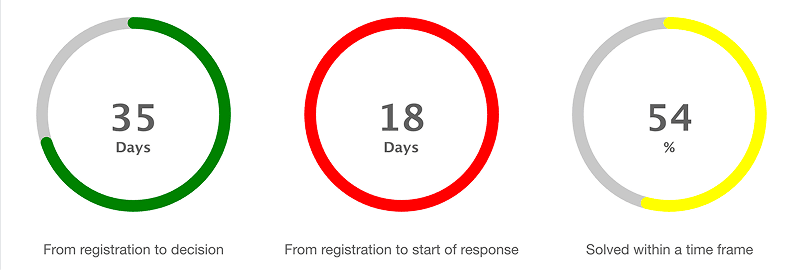
The Response Rate report includes three indicators.
From registration to decision
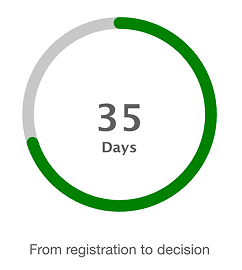 This indicator shows the average number of days between the registration of a case in the system and the point when the case reaches a status marked as Actions Taken.
Cases that have not reached an appropriate resolution stage, such as cases still under review or awaiting information, are excluded from this calculation.
Cases created through the Incident Report channel are also excluded.
The indicator uses 45 days as its reference threshold for colour highlighting.
From registration to start of response
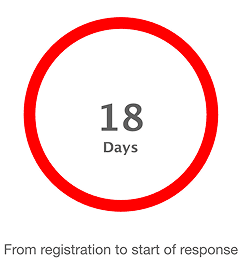 This indicator measures the number of days between case registration and the first status change indicating that a response has started.
It represents the time between receiving a case and the first recorded response in the system.
Cases created through the Incident Report channel are excluded from the calculation.
The indicator uses 7 days as its reference threshold for colour highlighting.
Solved within a time frame
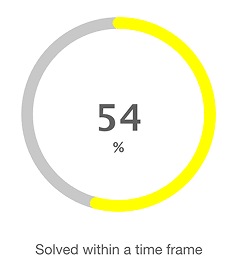 This indicator shows the percentage of cases with an Actions Taken status that reached a decision within the applicable regulatory timeframe.
The report uses a regulatory period of 30 days for this calculation.
The percentage is compared with a 90% threshold for colour highlighting.
Review changes over time
The Dynamics section shows how the selected response metric changes across the reporting period.
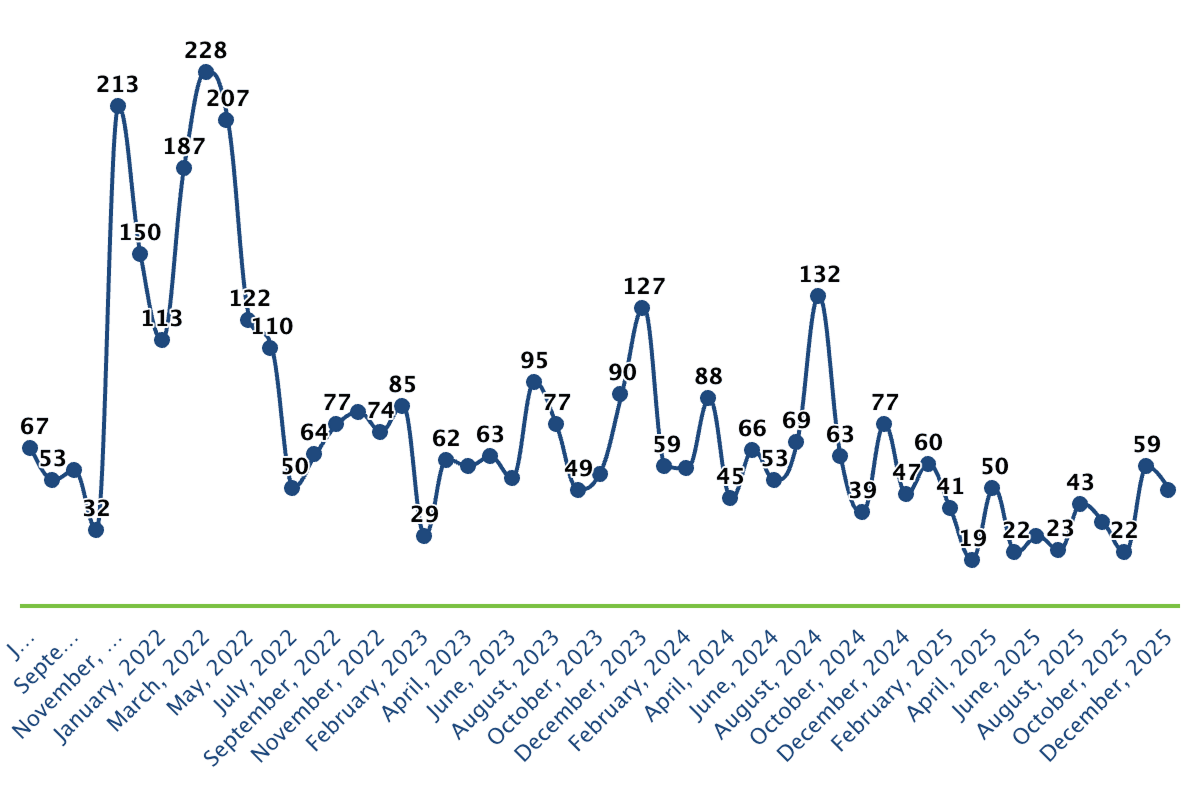
Use the metric selector next to Dynamics to choose the indicator you want to track, such as From registration to decision.
You can also select the time interval used to group the results, for example by months.
This helps you see whether response times are:
improving;
increasing;
remaining relatively stable;
changing significantly during particular periods.
A trend can provide more context than a single current-period value.
Export report charts
The Dynamics chart in the Response Rate report can be exported for use in reports and presentations.
Open the menu in the upper-right corner of a chart to access the available export options.
You can:
print the chart;
download it as a PNG image;
download it as a JPEG image;
download it as a PDF document;
download it as an SVG vector image.
How to use the report
The Response Rate report can help you identify where response or resolution times may require closer attention.
For example, you can use it to:
monitor the time between report registration and the first response;
compare decision times across reporting periods;
review the share of cases resolved within the expected timeframe;
compare response performance across categories, units, or channels;
identify periods where response times increased significantly.
Regularly reviewing these indicators can help teams identify workload or process issues and understand whether reporters are receiving timely attention.
Notes
The three indicators use different calculation rules and thresholds.
Cases from the Incident Report channel are excluded from the first two time-based calculations.
Solved within a time frame is based on cases that reached Actions Taken and uses a 30-day regulatory timeframe.
Filters affect the cases included in the report.
Available filters depend on your organisation's configuration.
Dynamics chart can be printed or exported in PNG, JPEG, PDF, or SVG format.
Access to the Response Rate report depends on your user permissions.