
The Investigation Duration report helps you analyse how long investigations take to complete and how investigation duration changes over time.
It allows you to compare the average investigation duration for the selected reporting period with the previous period, review how cases are distributed across different duration ranges, and track longer-term trends.
Where to find the Investigation Duration report
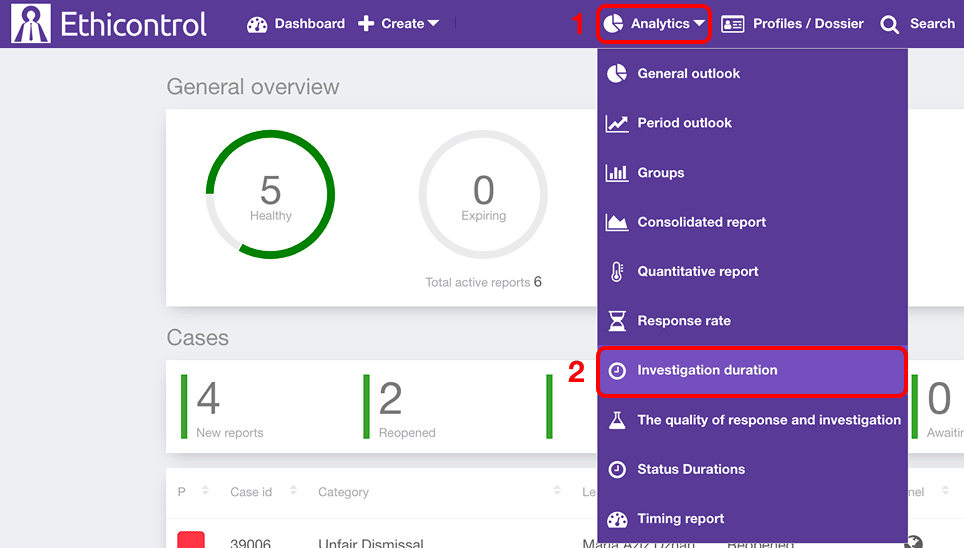
2. Select Investigation duration.
The report contains:
reporting period and filters;
average investigation duration comparison;
investigation duration distribution;
a Dynamics chart showing changes over time.
Select the reporting period
Use the date selector at the top of the report to define the period you want to analyse.
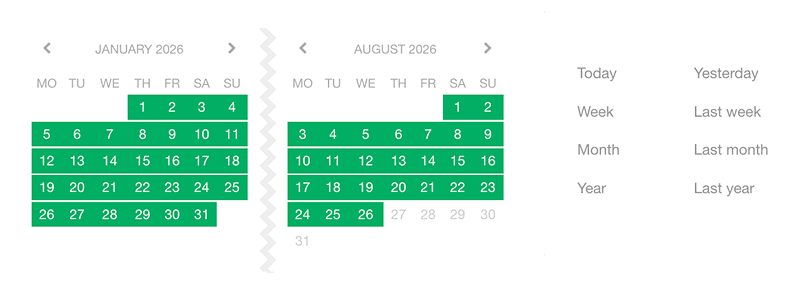
Today;
Yesterday;
Week;
Last week;
Month;
Last month;
Year;
Last year.
Changing the reporting period updates all charts in the report.
Filter the report
Use the available filters to narrow the analysis to a specific group of cases.

Depending on your organisation's configuration, filters may include:
Category;
Unit;
Assigned user;
Channel;
Priority;
Region;
Segment;
Procedure;
Event date / Actual incident date;
Resolution date.
You can combine several filters to analyse investigation duration for a specific part of the organisation or type of case.
Compare average investigation duration
The first chart compares the average investigation duration for the selected reporting period with the previous period.
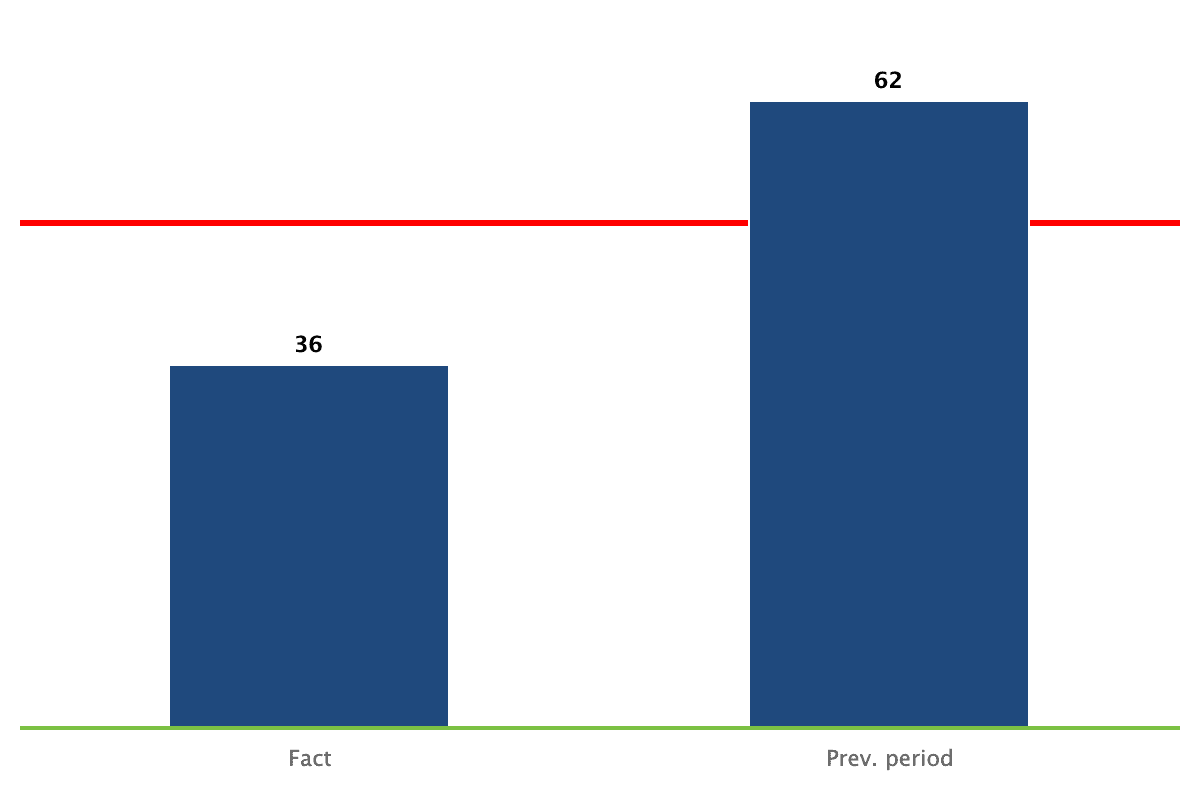
Fact — the average investigation duration for the selected period.
Prev. period — the corresponding value for the previous period.
This comparison helps you see whether investigations are generally taking more or less time than before.
A change in the average should be reviewed together with the underlying cases. Longer investigations may reflect case complexity or other circumstances rather than a problem with the investigation process.
Review the distribution of investigation duration
The distribution chart shows what percentage of investigations falls within different duration ranges.
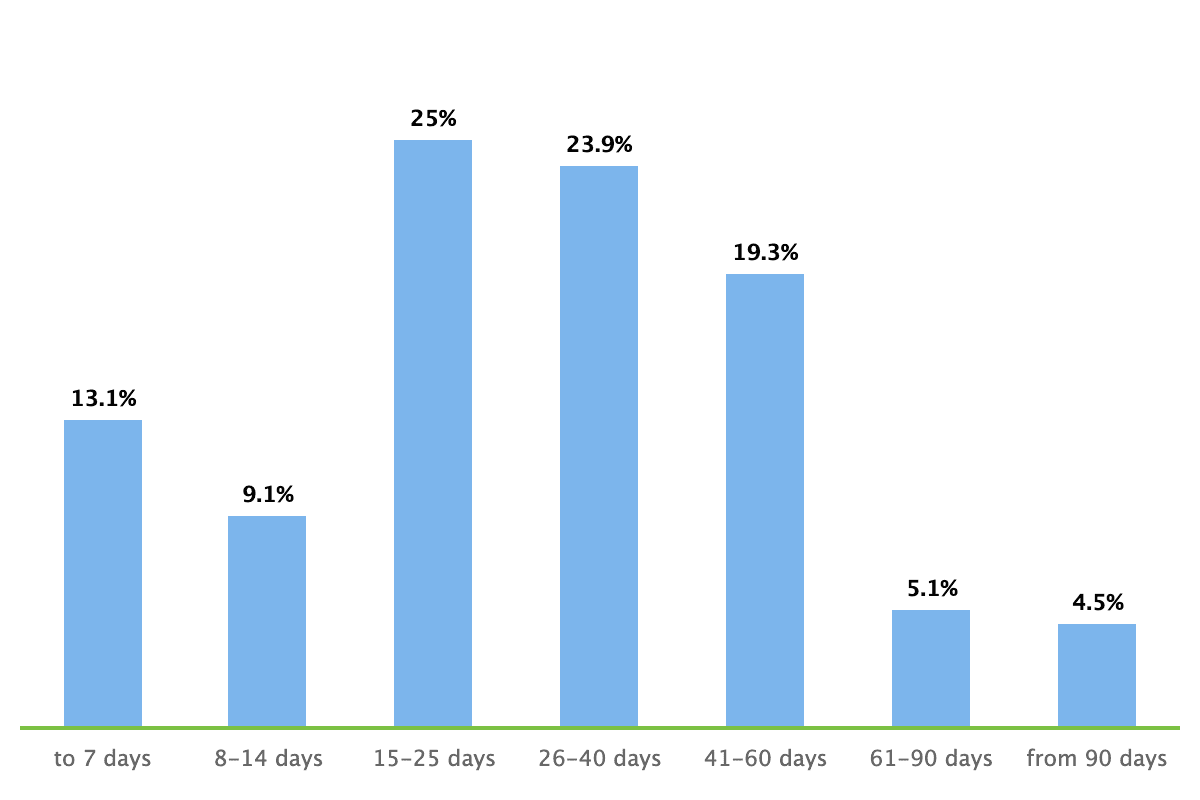 The ranges may include:
- up to 7 days;
- 8–14 days;
- 15–25 days;
- 26–40 days;
- 41–60 days;
- 61–90 days;
- more than 90 days.
This provides more context than the average alone.
For example, two reporting periods may have similar average investigation durations while having very different distributions. One period may contain mostly medium-length investigations, while another includes a combination of very short and very long cases.
Use the distribution to identify where most investigations fall and whether a significant share of cases is taking considerably longer to complete.
Review investigation duration over time
The Dynamics section shows how investigation duration changes across the selected period.
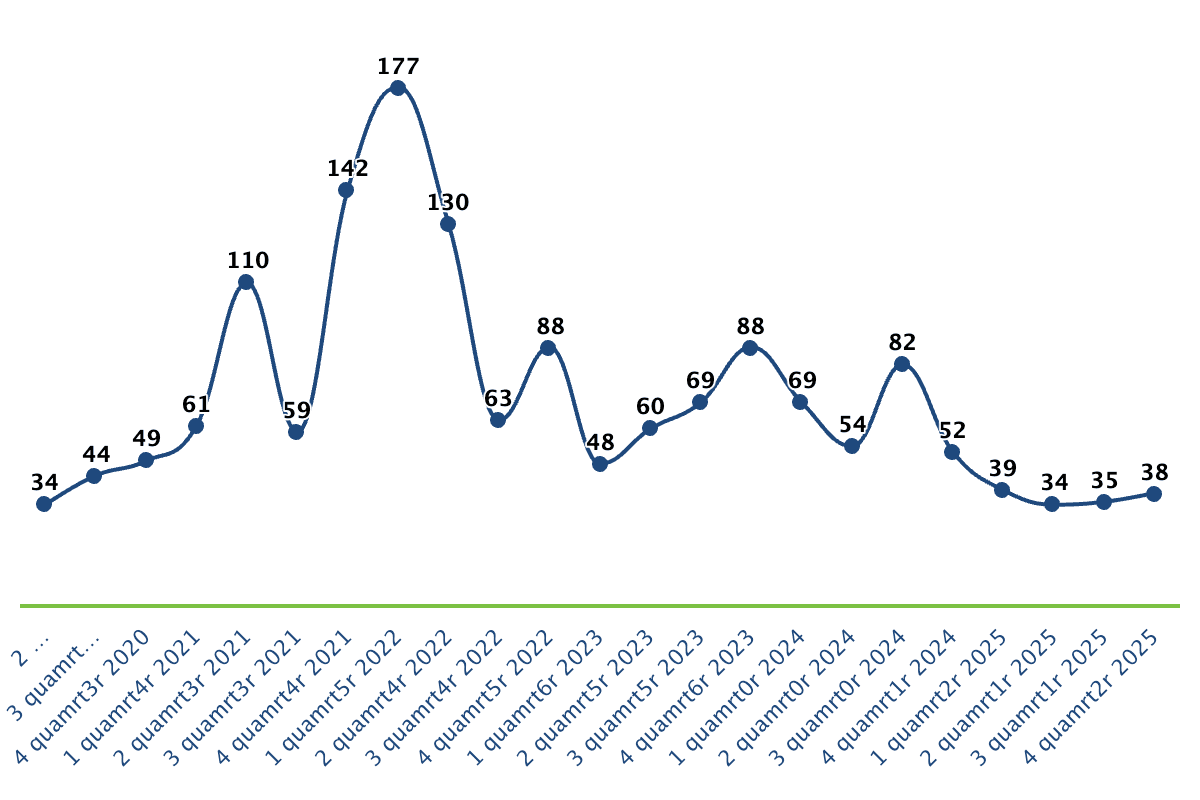
Use it to identify longer-term trends rather than comparing only two periods.
Depending on the selected period and available options, the chart can group the data into time intervals such as months or quarters.
This can help you see whether investigation duration is:
increasing;
decreasing;
remaining relatively stable;
changing significantly during particular periods.
When you identify an unusual change, use filters or review the relevant cases to understand what may have contributed to it.
Export report charts
The charts in the Investigation Duration report can be exported for use in internal reports, presentations, or further analysis.
Open the menu in the upper-right corner of a chart to access the available options.
You can:
Print the chart;
download it as a PNG image;
download it as a JPEG image;
download it as a PDF document;
download it as an SVG vector image.
Each chart can be exported separately, allowing you to use the specific visualisation you need.
How to use the report
The Investigation Duration report can help compliance and investigation teams identify patterns in how long investigations take.
For example, you can use it to:
compare investigation duration with the previous period;
identify whether a growing share of cases is taking more than 60 or 90 days;
compare investigation duration across categories, units, or channels;
monitor whether investigation times are improving over several months or quarters;
identify periods or groups of cases that may require closer review.
Investigation duration can also be considered alongside response-time and deadline metrics to build a broader view of case-management performance.
Notes
The report reflects cases included in the selected reporting period and filters.
Average investigation duration should be interpreted together with the duration distribution and underlying case context.
A longer investigation is not necessarily a sign of poor performance, as case complexity and investigation requirements can vary.
Available filters depend on your organisation's configuration.
Charts can be printed or exported in PNG, JPEG, PDF, or SVG format.
Access to the Investigation Duration report depends on your user permissions.