
The Quality of Response and Investigation report helps you evaluate how effectively cases are handled and resolved.
Instead of focusing only on the number of reports or processing time, it provides indicators related to case closure, substantiation, and follow-up actions. This helps compliance and investigation teams review whether cases are progressing towards meaningful outcomes.
Where to find the report
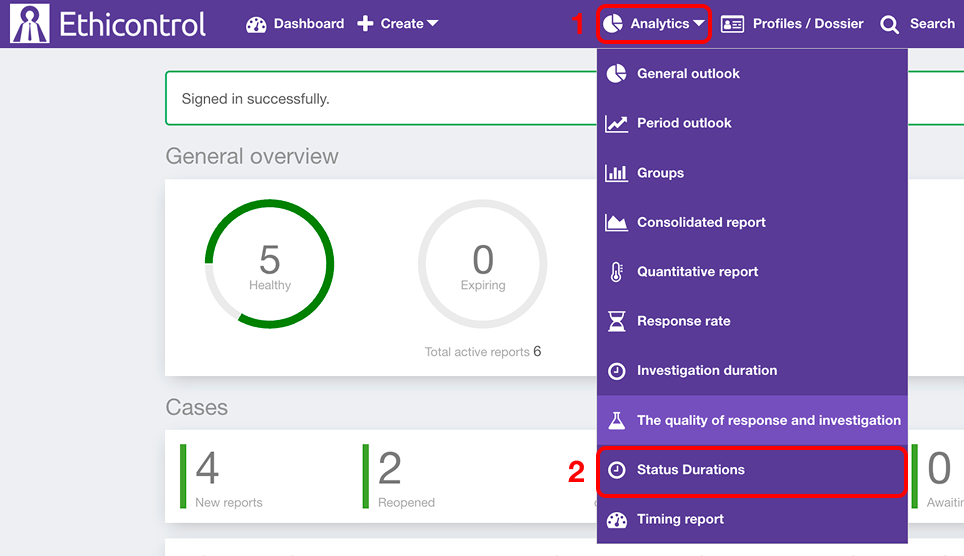 1. Open Analytics from the main navigation.
2. Select The quality of response and investigation.
The report displays:
filters and a reporting period;
three case-handling indicators;
a Dynamics chart showing changes over time.
Understand the main indicators
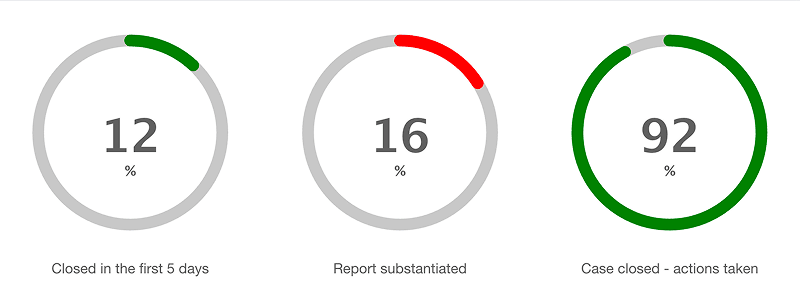
The report includes three percentage-based indicators.
| Indicator | What it shows |
|---|---|
| Closed in the first 5 days | This indicator shows what percentage of cases were closed within five days. |
| Report substantiated | This indicator shows the percentage of reports that resulted in a substantiated finding. |
| Case closed – actions taken | This indicator shows the percentage of closed cases where follow-up actions were recorded. |
Select the reporting period
Use the date selector at the top of the report to define the period included in the analysis.
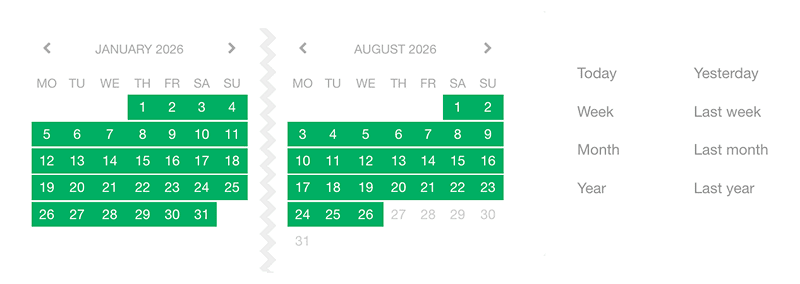
You can select a custom date range or use one of the available predefined periods, such as:
Today;
Yesterday;
Week;
Last week;
Month;
Last month;
Year;
Last year.
Changing the date range updates the indicators and Dynamics data for the selected period.
Filter the report
You can narrow the report to a specific group of cases using the available filters.

Depending on your organisation's configuration, filters may include case attributes such as:
Category;
Unit;
Assigned user;
Channel;
Priority;
Region;
Segment;
Procedure;
incident or event date;
resolution date.
You can combine several filters to create a more specific analysis.
Use Clear Filters to remove the selected filters and return to the broader report.
Review changes over time
The Dynamics section helps you see how performance changes across the selected reporting period.
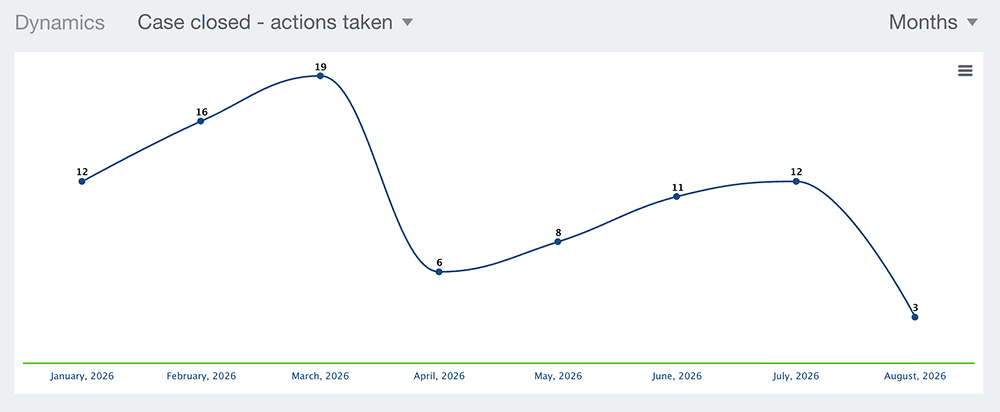
For example, the report can display the Case closed – actions taken indicator by month, making it easier to see whether the result is increasing, decreasing, or remaining relatively stable.
This provides more context than a single percentage because it shows how the indicator develops over time.
How to use the report
The Quality of Response and Investigation report can be used to review different aspects of case-management performance together.
For example, a team may see that:
a relatively small share of cases is closed within five days;
only a certain proportion of reports is substantiated;
most closed cases result in recorded follow-up actions.
These indicators describe different parts of the process and should not be interpreted as a single performance score.
Filters can then help determine whether a particular pattern is associated with a specific category, unit, reporting channel, or other group of cases.
Notes
All three main indicators are displayed as percentages.
Results depend on the cases included in the selected period and filters.
Available filter values depend on your organisation's configuration.
The indicators should be interpreted together with the context, complexity, and outcomes of the underlying cases.
Access to the report depends on your user permissions.