
The General Outlook report provides a quick overview of the cases currently handled in the system.
It helps you review case activity, identify cases that may require attention, analyse trends over time, and break case data down across multiple organisational and case-management dimensions without opening individual cases one by one.
Where to find General Outlook
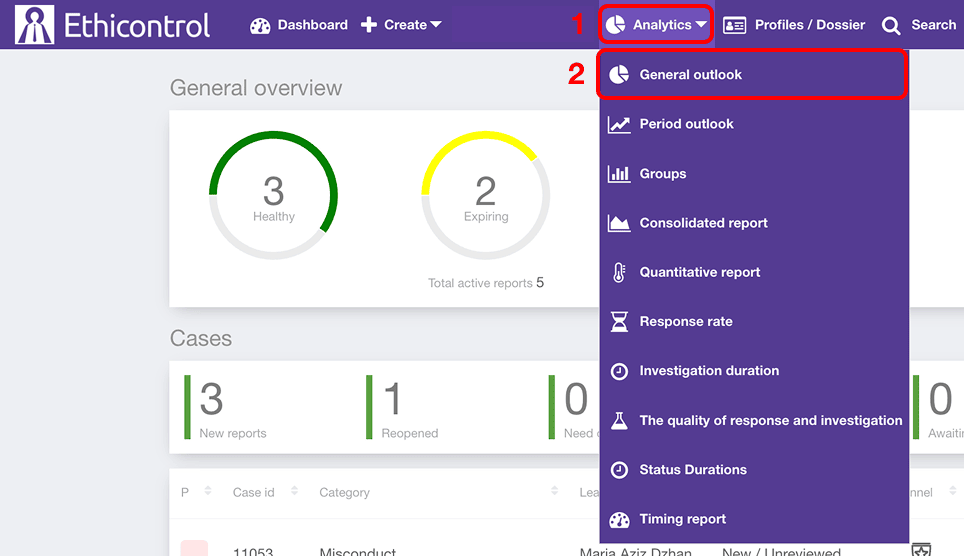 1. Open Analytics from the main navigation.
2. Select General outlook.
The report includes:
- reporting period and filters;
- a case-activity chart;
- total case count;
- case statistics by category;
- status breakdown within each category.
Select the reporting period
Use the date selector at the top of the report to define the period included in the analysis.
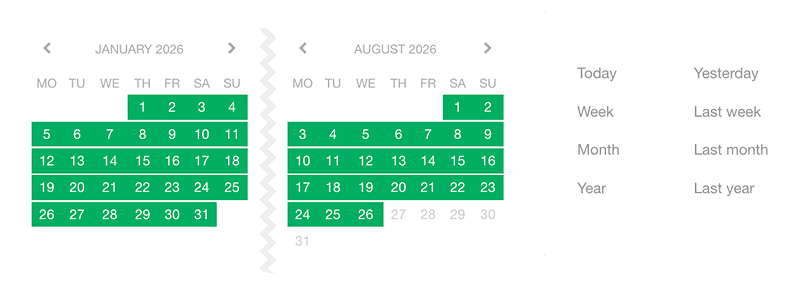
You can select a custom date range or use one of the available predefined periods, such as:
Today;
Yesterday;
Week;
Last week;
Month;
Last month;
Year;
Last year.
Changing the date range updates the report data.
Filter the report
Use the available filters to narrow the analysis to the cases you want to review.

You can use a single filter or combine several filters to make the selection more specific.
Depending on your organisation's configuration, filters may include attributes such as:
Category;
Unit;
Assigned user;
Channel;
Priority;
Region;
Segment;
Procedure;
Event date / Actual incident date;
Resolution date;
other organisation-specific case attributes.
Use Clear Filters to remove the selected filters and return to the broader overview.
Review case activity over time
The chart shows how case activity changes across the selected reporting period.
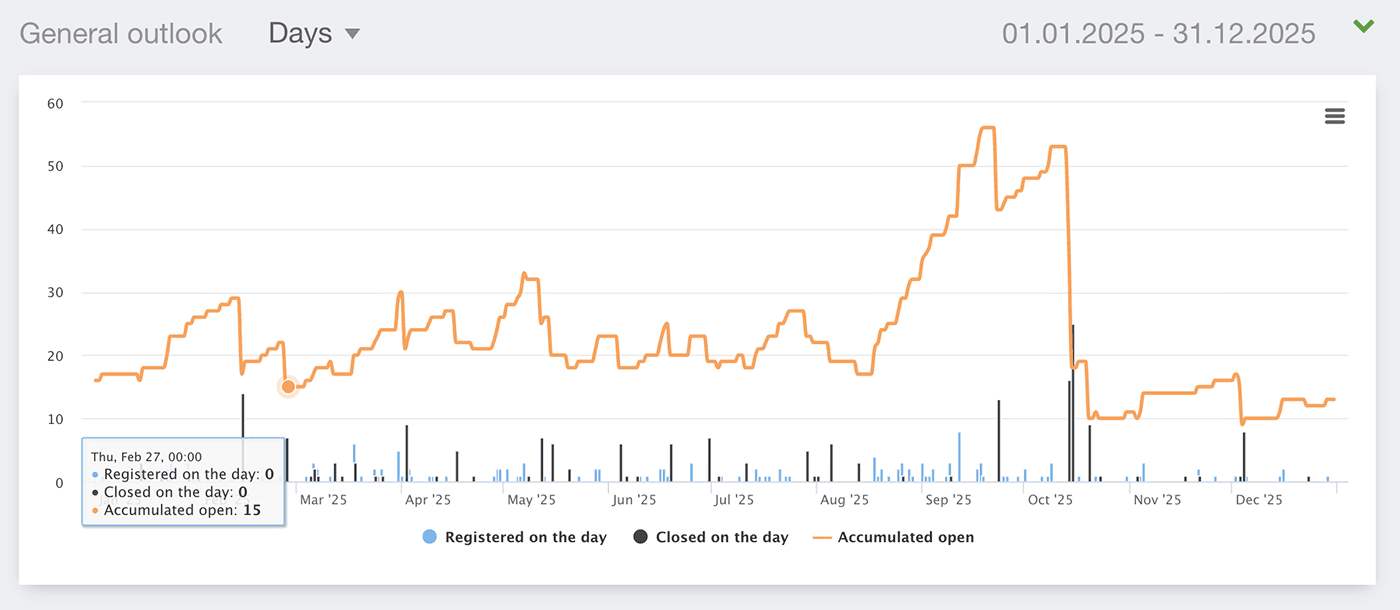
It can display indicators such as:
newly registered cases;
closed cases;
total open cases;
accumulated open cases.
This helps you identify increases or decreases in reporting and case-processing activity over time.
For example, you can use the chart to see whether:
new case volumes are increasing;
more cases are being closed;
the number of open cases is accumulating;
an unusual spike occurred during a particular period.
Change the chart time interval
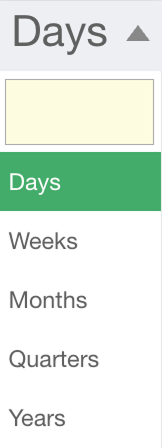
Use the interval selector to change how the chart groups data over time.
Available options may include:
- Days
- Weeks
- Months
- Quarters
- Years
Choose a shorter interval for detailed analysis or a longer interval when reviewing broader trends.
Review case data with the breakdown table
The breakdown table provides a structured view of case data and allows you to analyse cases across one or two dimensions.
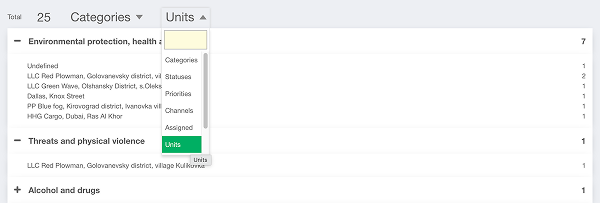
Instead of reviewing only a predefined category breakdown, you can choose which case attribute should form the main rows of the table and, when needed, add a second level of detail.
Available dimensions include:
- Categories
- Units / departments
- Priorities
- Channels
- Statuses
- Routes / procedures
- Assignees
- Regions
The available values depend on your organisation's configuration.
Choose the parent dimension
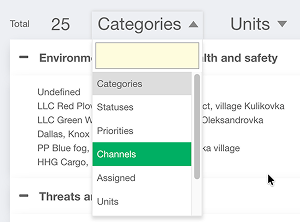 Use the parent selector to choose the main dimension for the breakdown.
For example, select Regions to display case data by region, or Assignees to compare cases assigned to different users.
Each parent value appears as a separate top-level row in the table.
Parent rows are visually distinguished to make the structure easier to scan when a second level is added.
Add a child dimension
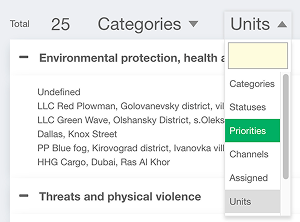
The child dimension can use the same set of attributes as the parent dimension.
For example:
- Regions → Channels shows which reporting channels were used within each region.
- Assignees → Priorities shows how cases assigned to each user are distributed by priority.
- Units → Statuses shows the status distribution within each organisational unit.
This allows you to create different analytical views without exporting the case data first.
Combine dimensions for deeper analysis
Parent and child dimensions can be changed independently depending on the question you want to answer.
For example, you can use General Outlook to review:
- case volume by Channel within each Region;
- Priorities by Assignee;
- Statuses within each Unit;
- Categories by Procedure;
- Channels by Category.
Changing the dimensions changes how the same case dataset is organised in the table. It does not change the underlying case records.
How to use General Outlook
General Outlook is useful when you need a fast overview before moving into more detailed analytics.
For example, you can use it to:
review overall case activity;
identify periods with unusually high reporting volumes;
monitor whether open case volumes are increasing;
compare activity across selected periods;
identify categories with the highest number of cases;
review the status distribution within a category;
narrow the view using filters before performing deeper analysis.
For more specialised analysis, use reports such as Period Outlook, Groups, Response Rate, Investigation Duration, Status Durations, or Timing Report.
Notes
General Outlook reflects the reporting period and filters currently selected.
Available filters and categories depend on your organisation's configuration.
Status values depend on your organisation's case-management workflow.
The chart provides a high-level view of case activity; use the category and status breakdown or individual cases for additional context.
The breakdown table supports both parent and child dimensions.
Categories, Units, Priorities, Channels, Statuses, Procedures, Assignees, and Regions can be used as breakdown dimensions.
Parent rows are visually distinguished when a child dimension is used.
Available dimension values depend on your organisation's configuration.
Access to General Outlook depends on your user permissions.