
The Consolidated Report brings key case-management statistics and performance information together in one report.
Instead of reviewing several analytics sections separately, you can use it to get a structured overview of reporting activity, case statuses, categories, individual incidents, and other case-management indicators for a selected period.
Where to find the Consolidated Report
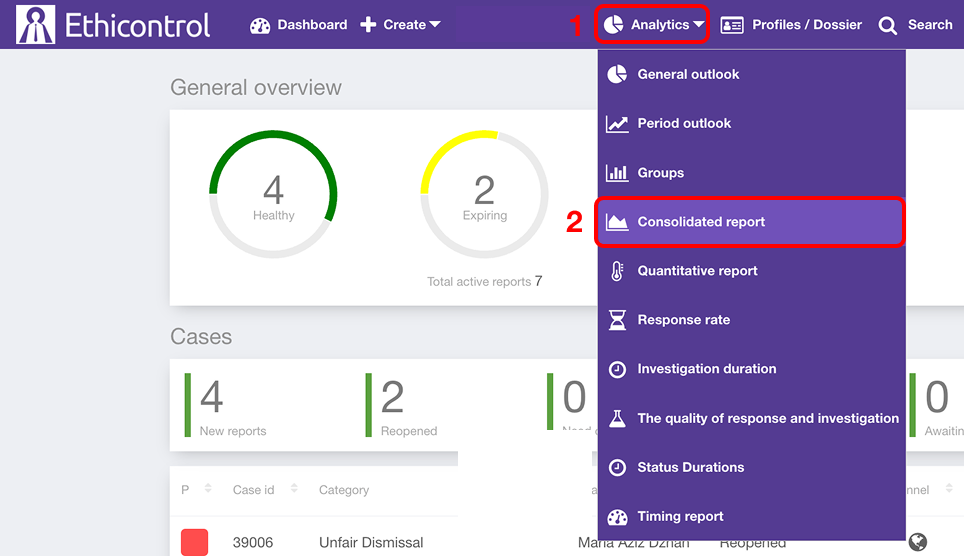
2. Select Consolidated report.
The report contains several sections that provide different levels of detail, from a short summary to individual incident records.
Choose the reporting period
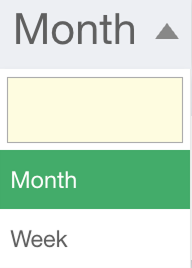 At the top of the report, select how the report should be generated:
- Month
- Week
Use Month for a broader monthly overview or Week when you need a more detailed view of shorter-term activity.
Then select the relevant date or period.
The information in the report updates according to the selected reporting period.
Review the Summary
The Summary provides a short written overview of activity during the selected period.
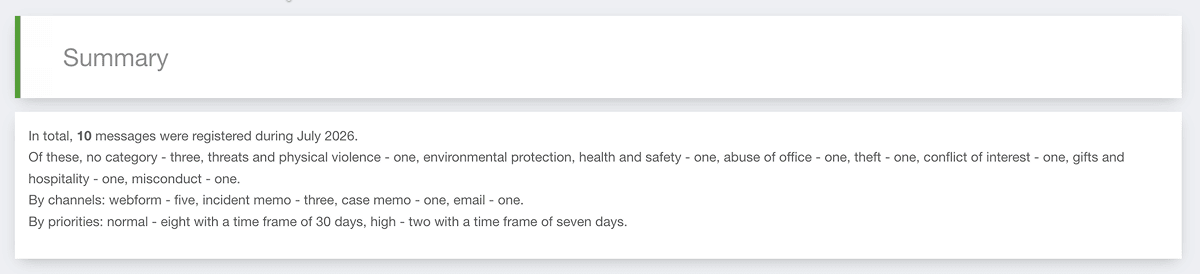
It can summarise information such as:
the total number of registered messages;
distribution by category;
distribution by reporting channel;
distribution by priority.
For example, instead of reviewing several tables individually, you can use the Summary to quickly understand how many reports were received and what types of reports made up that activity.
Review General Dynamics
The General Dynamics section shows how case activity changes during the selected period.
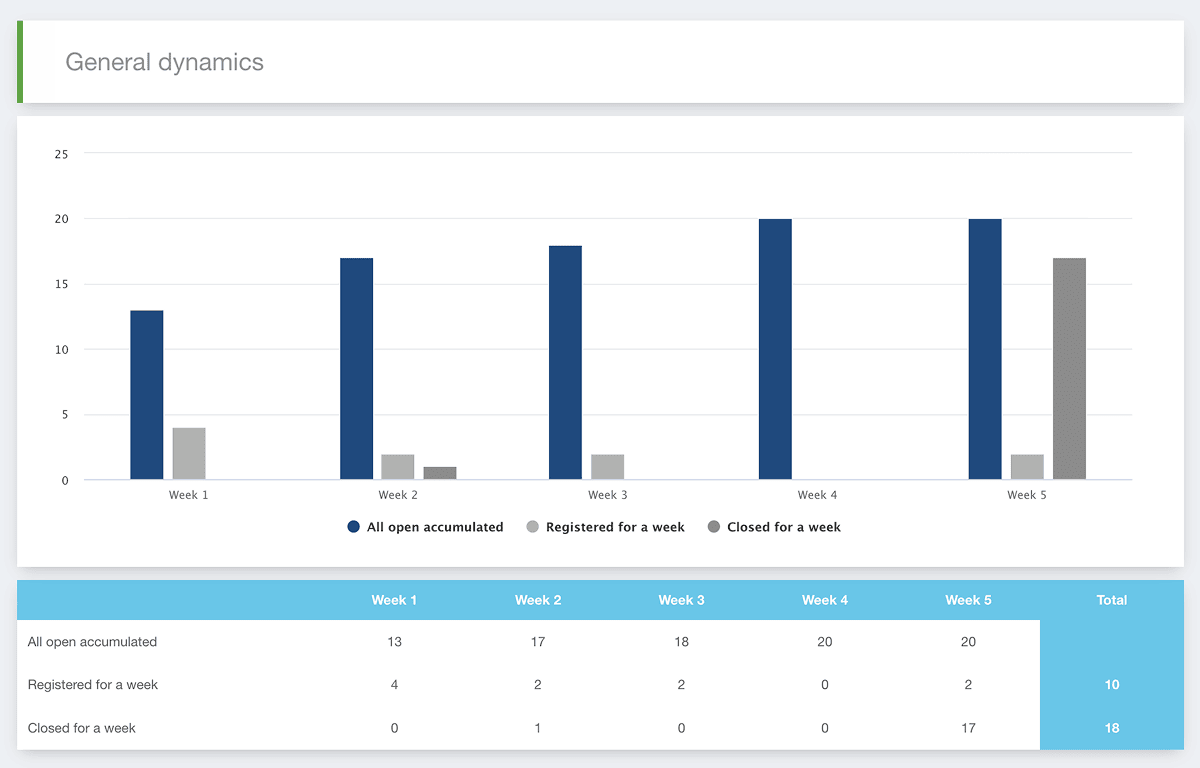
It helps you compare key case volumes such as:
registered cases;
opened cases;
closed cases.
The chart and accompanying table make it easier to see whether reporting or case-processing activity changed between individual weeks or other intervals within the selected period.
Review statistics by status
The Statistics by status as of the end of the period section breaks down cases according to their status.
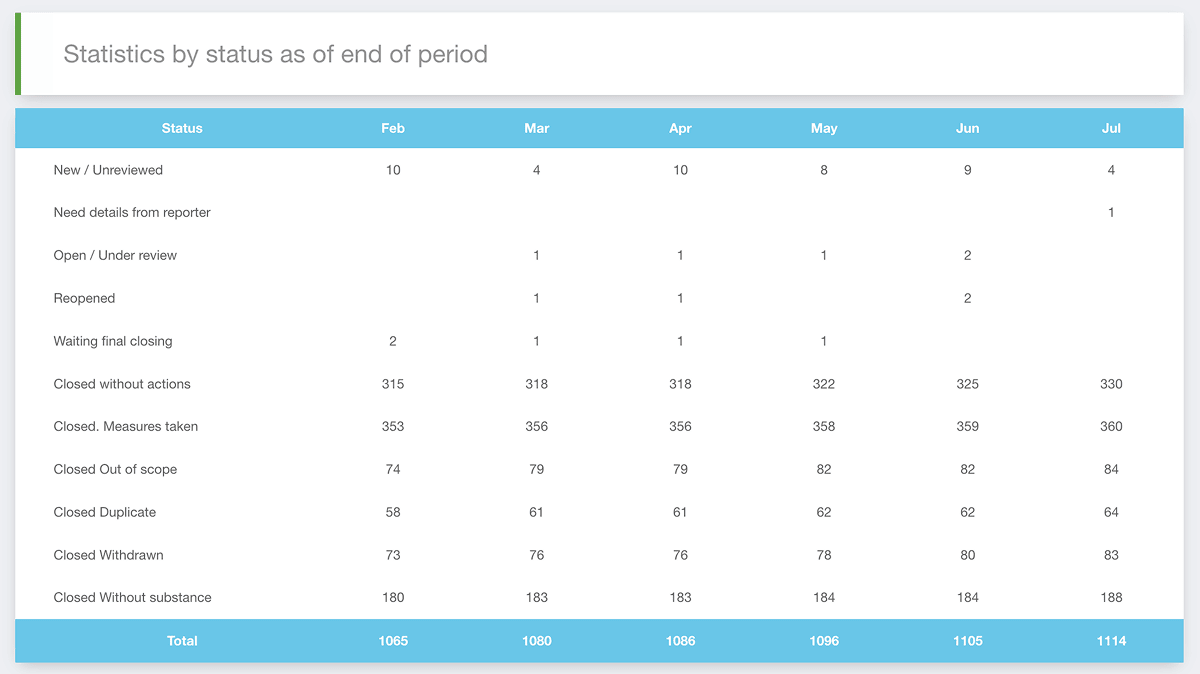
Use this section to understand how cases are distributed across the case-management workflow at the end of the selected reporting period.
Depending on your organisation's workflow, the table may include statuses such as new, under review, reopened, awaiting decision, remediation, or closed.
The exact statuses depend on your organisation's configuration.
Review statistics by category
The Statistics by category section groups case activity by case category.
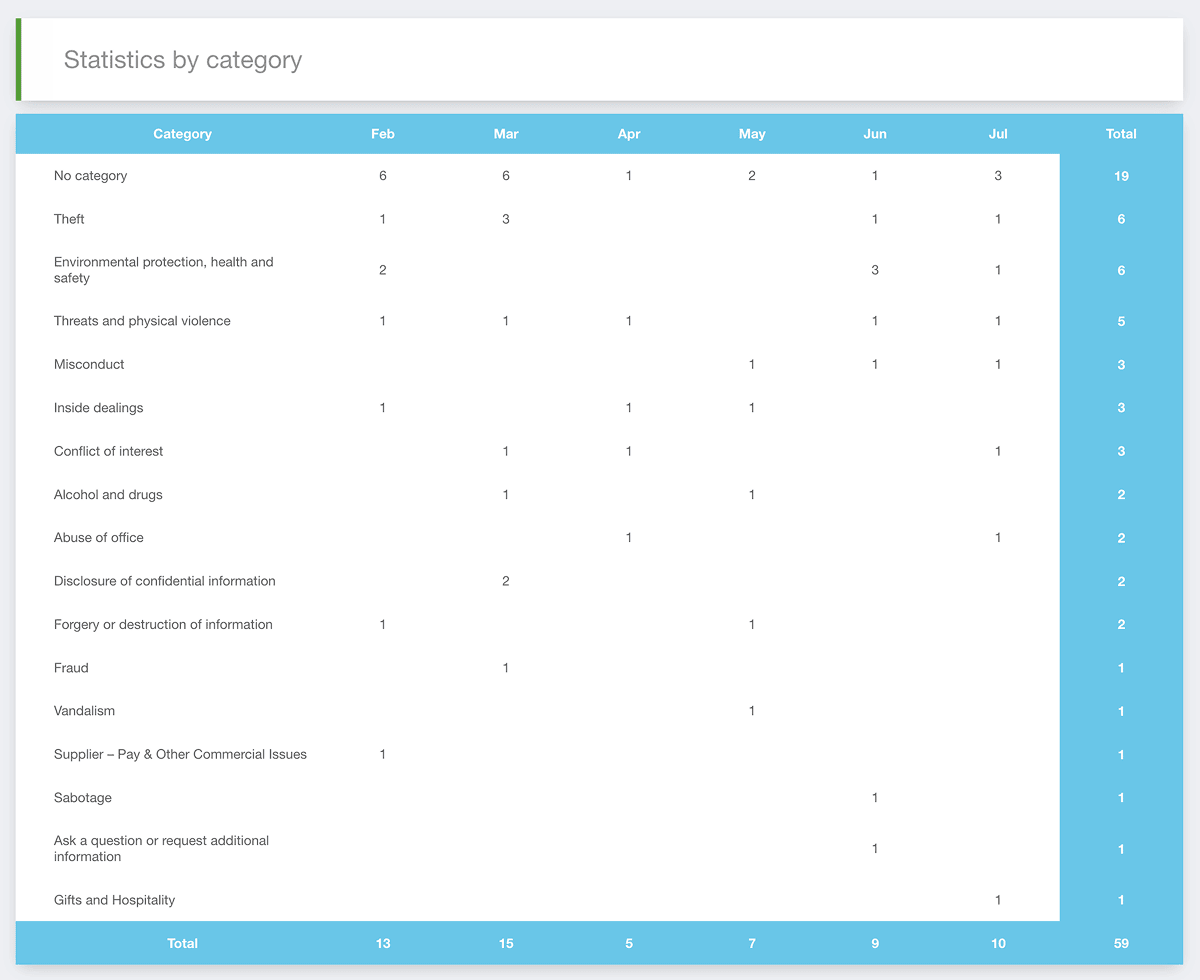
It helps you see which types of incidents were reported during the period and compare their frequency.
For example, the report may show activity for categories such as:
- misconduct;
- theft;
- conflict of interest;
- threats and physical violence;
- environmental protection, health and safety;
- other organisation-specific categories.
The available categories depend on your organisation's classification structure.
Review individual incidents
The Detailed description of incidents section provides a more granular view of the cases included in the report.
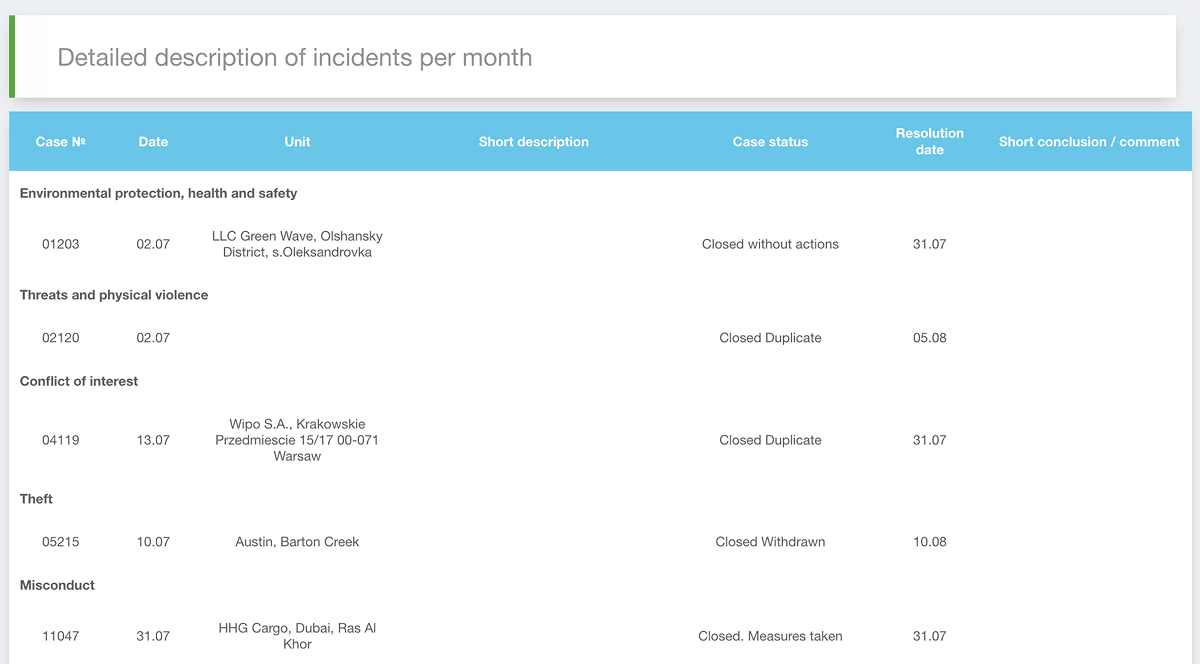
Instead of showing only aggregated numbers, it allows you to review individual incident records and their associated information.
Use this section when an unusual value in the summary or statistics requires more context, and you want to see the cases behind the aggregate result.
Review other statistics
The Other statistics section provides additional case-management indicators included in the Consolidated Report.
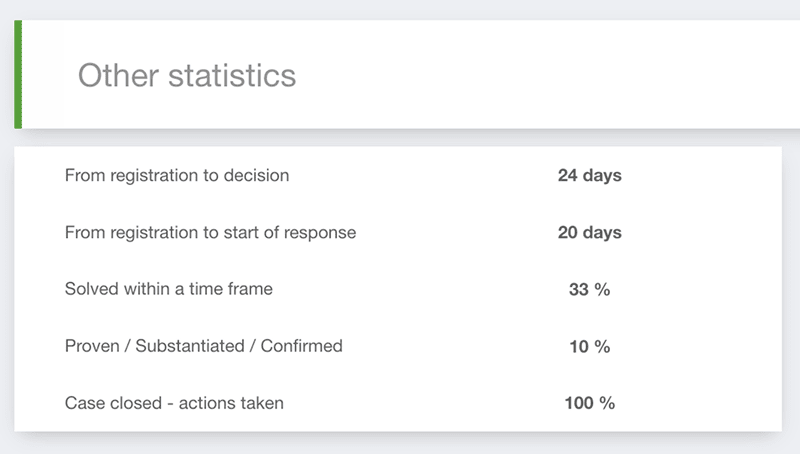
These indicators complement the case volumes, categories, and statuses shown earlier in the report and provide additional context for evaluating activity during the selected period.
The available values depend on the data and reporting configuration used by your organisation.
How the sections work together
Each section provides a different level of detail.
| Section | What it helps you understand |
|---|---|
| Summary | A quick written overview of the reporting period |
| General Dynamics | How case activity changed during the period |
| Statistics by status | Where cases were in the workflow |
| Statistics by category | What types of cases were in work |
| Detailed description of incidents | The individual cases behind the statistics |
| Other statistics | Additional case management indicators |
For example, you may first notice an increase in registered cases in General Dynamics, then use Statistics by category to identify which categories contributed to the increase, and finally review the Detailed description of incidents for additional context.
How to use the Consolidated Report
The report is useful when you need a single overview of case-management activity without moving between several analytics pages.
You can use it to:
prepare a regular weekly or monthly compliance review;
understand changes in reporting activity;
review the distribution of cases by status and category;
connect aggregated statistics with individual incidents;
provide management with a structured overview of case activity;
identify areas that may require deeper analysis in other Analytics reports.
For more detailed analysis of a specific metric, you can then use dedicated reports such as Response Rate, Investigation Duration, Status Durations, or Timing Report.
Notes
The report can be generated by Month or Week.
The information shown depends on the selected reporting period.
Available statuses and categories depend on your organisation's configuration.
The Consolidated Report combines several types of case-management data but does not replace more specialised Analytics reports when deeper analysis is required.
Access to the Consolidated Report depends on your user permissions.