
The Quantitative Report provides a consolidated view of the key numerical indicators recorded through your case management process.
It can be used to review case volumes, financial impact, recoveries, and selected case or legal outcomes. The Dynamics section also allows you to select an individual indicator and analyse how it changes over time.
Where to find the Quantitative Report
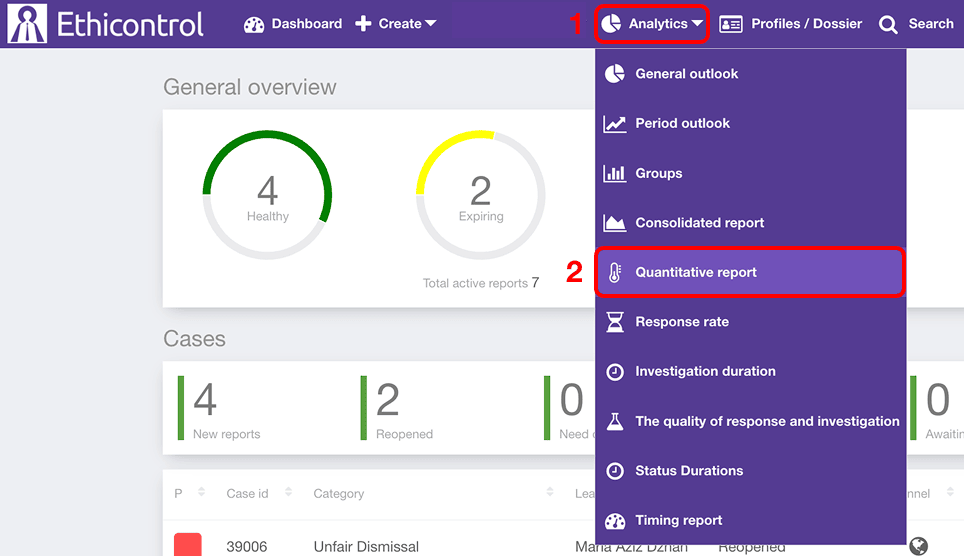 1. Open Analytics from the main navigation.
2. Select Quantitative report.
The report contains:
reporting period and filters;
a table with quantitative indicators and their values;
a configurable Dynamics chart.
Select the reporting period
Use the date selector at the top of the report to define the period included in the analysis.
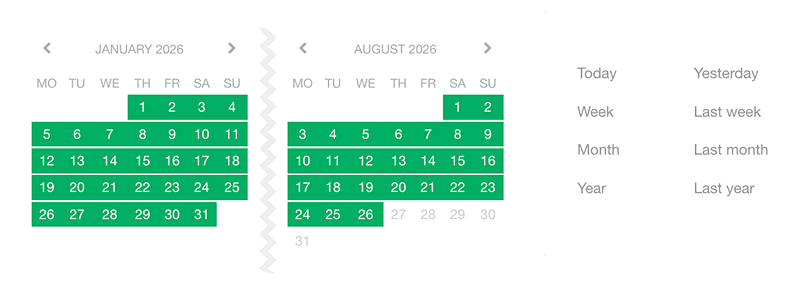
You can select a custom date range or use one of the available predefined periods, such as:
Today;
Yesterday;
Week;
Last week;
Month;
Last month;
Year;
Last year.
Changing the reporting period updates the values displayed in the report.
Filter the report
Use the available filters to narrow the report to the cases you want to analyse.

Depending on your organisation's configuration, filters may include case attributes such as:
Category;
Region;
Unit;
Assigned user;
Channel;
Priority;
Segment;
Procedure;
Event date / Actual incident date;
Resolution date.
Financial filters may also be available where relevant to your organisation's reporting configuration.
You can combine several filters to analyse a specific group of cases.
Review quantitative indicators
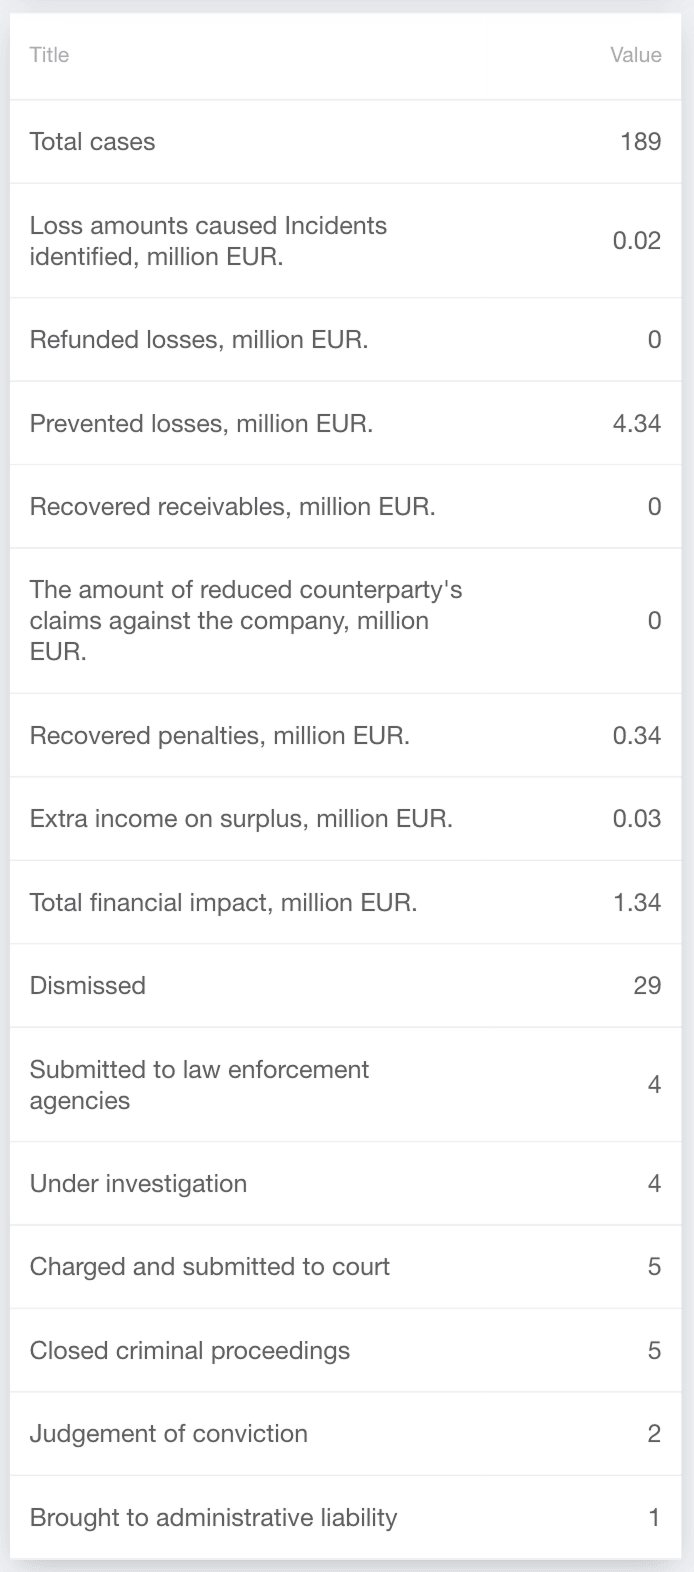
The main table displays each available indicator together with its calculated Value for the selected period and filters.
The report can include several types of indicators.
 Case volume
Total cases shows the number of cases included in the current report.
This provides a basic volume measure that can also be analysed over time in the Dynamics section.
Financial impact
Depending on the data recorded in your cases, financial indicators may include:
- Loss amounts caused by incidents identified, million EUR
- Refunded losses, million EUR
- Prevented losses, million EUR
- Recovered receivables, million EUR
- The amount of reduced counterparty's claims against the company, million EUR
- Recovered penalties, million EUR
- Extra income on surplus, million EUR
- Total financial impact, million EUR
These indicators help quantify the financial consequences of incidents as well as amounts recovered, prevented, or otherwise affected through case handling.
The availability and values of these indicators depend on the information recorded in your organisation's cases.
Case and legal outcomes
The report can also include quantitative indicators related to case or legal outcomes, such as:
Dismissed
Submitted to law enforcement agencies
Under investigation
Charged and submitted to court
Closed criminal proceedings
Judgement of conviction
Brought to administrative liability
This allows you to review not only how many cases were registered but also how many reached specific outcomes or stages recorded by your organisation.
Review an indicator over time
The Dynamics section allows you to select one quantitative indicator and see how it changes across the reporting period.
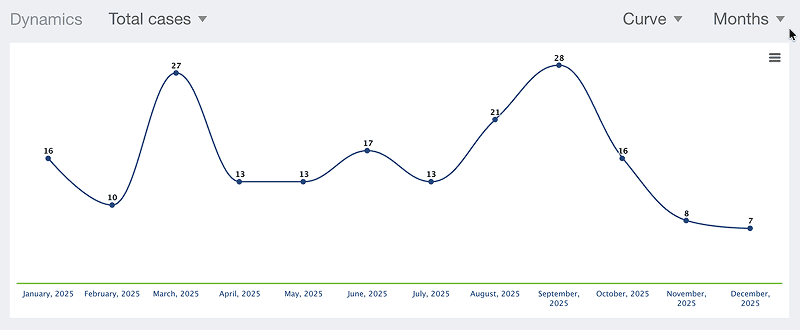
Open the indicator selector next to Dynamics and choose the metric you want to analyse.
For example, you can select:
Total cases to track changes in case volume;
a financial indicator to monitor losses, recoveries, or financial impact;
Under investigation to track the number of relevant cases over time;
Judgement of conviction or another outcome to monitor changes in recorded results.
The chart updates according to the selected indicator.
Choose the chart type
Use the chart-type selector to choose how the Dynamics data is displayed.
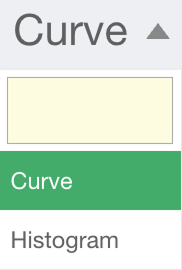 Available options include:
- Curve
- Histogram
Use Curve when you want to follow the direction of a metric over time.
Use Histogram when you want to compare values between individual periods more directly.
Changing the chart type changes only the visual presentation of the selected data.
Choose the time interval
You can also control how the Dynamics data is grouped over time.
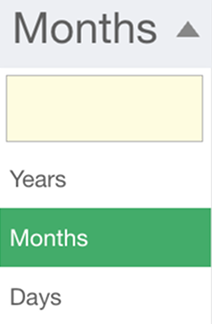 Available intervals include:
- Years
- Months
- Days
For example, selecting Months shows the selected indicator month by month across the reporting period.
Choose an interval that matches the period and level of detail required for your analysis.
Export the Dynamics chart
The Dynamics chart can be exported for use in reports, presentations, or other internal materials.
Open the menu in the upper-right corner of the chart.
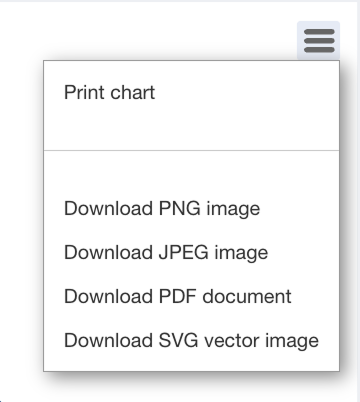 You can:
- Print the chart;
- download it as a PNG image;
- download it as a JPEG image;
- download it as a PDF document;
- download it as an SVG vector image.
The exported chart reflects the currently selected indicator, chart type, time interval, reporting period, and filters.
How to use the report
The Quantitative Report can help compliance and management teams analyse both the scale and measurable impact of cases.
For example, you can use it to:
track whether the number of cases is increasing or decreasing;
monitor financial losses associated with reported incidents;
review amounts recovered or losses prevented;
measure total financial impact;
track how many cases reach selected legal or case outcomes;
analyse an individual indicator by day, month, or year.
This makes it possible to move beyond simply counting reports and examine how the measurable impact and outcomes of cases change over time.
Notes
Indicators available in the report depend on your organisation's configuration and the data recorded in cases.
Financial indicators are displayed using the units configured for the corresponding metric; the examples shown in the report use million EUR.
Filters affect both the indicator table and Dynamics data.
The indicator selector determines which metric is displayed in the Dynamics chart.
Dynamics can be displayed as a Curve or Histogram and grouped by Years, Months, or Days.
The Dynamics chart can be printed or exported in PNG, JPEG, PDF, or SVG format.
Access to the Quantitative Report depends on your user permissions.